Understanding Pressurized Steady State Flow and Piezometric Lines

A full pipe can look simple from the outside: water enters, water leaves, and the pipe stays full. Inside that pipe, though, pressure, elevation, velocity, and friction are trading energy all along the route. Two lines help make that hidden behavior visible: the pressure line and the piezometric line.
These lines are not decorative curves on a drawing. They tell engineers where pressure is high, where pressure may become dangerously low, how much energy the flow loses to friction, and whether a system can deliver water to the right place at the right pressure.
In pressurized steady state flow, the pipe remains full and the flow conditions at each location do not change with time. That makes the system easier to analyze, but not trivial. A long pipe may climb a hill, pass through a valve, narrow through a fitting, and discharge into a tank. The pressure line and piezometric line help explain what happens through each part.

Steady pressurized flow gives us a stable picture
Pressurized flow means the conduit is completely full of fluid. The flow does not have a free surface open to the atmosphere, as it would in a partially full channel or an open canal. A water main, a force main, a cooling-water pipe, and a closed irrigation pipeline are all common examples.
Steady state means the main flow variables at a fixed point do not change with time. At any given section of pipe, the following values remain constant:
Pressure
Velocity
Flow rate
Depth of the pipe centerline below or above a datum
Energy head
The flow may still vary from one location to another. A pipe can have high pressure near a pump and lower pressure farther downstream. The velocity can change if the pipe diameter changes. The pipe may rise and fall with the ground. Steady does not mean uniform everywhere. It means stable in time.
A simple steady pressurized pipe analysis usually starts with the continuity equation:
```text
Q = A V
```
Where:
`Q` is flow rate
`A` is pipe cross-sectional area
`V` is average velocity
For incompressible flow, if the pipe diameter stays the same and there are no branches, the flow rate and velocity stay the same along that reach. If the diameter changes, the velocity changes because the same flow must pass through a different area.
The next step is energy. In pipe hydraulics, engineers often work in terms of head, which means energy per unit weight of fluid. For water systems in US practice, head is commonly expressed in feet of water.
The total head at a pipe section includes three main parts:
```text
Total head = elevation head + pressure head + velocity head
```
Written as an equation:
```text
H = z + p/γ + V²/(2g)
```
Where:
`H` is total head
`z` is elevation head relative to a chosen datum
`p/γ` is pressure head
`V²/(2g)` is velocity head
`p` is pressure
`γ` is the specific weight of the fluid
`g` is gravitational acceleration
That equation sits behind the pressure line, the piezometric line, and the energy line.
The pressure line shows pressure head along the pipe
The pressure line represents the pressure head in the pipe, usually measured relative to the pipe centerline. In plain terms, it shows how high water would rise above the pipe at each point if a small vertical tube were connected there and open to the atmosphere.
That height is the pressure head:
```text
Pressure head = p/γ
```
If the pressure at a pipe section equals 20 feet of water, a piezometer tube connected to that point would show water standing 20 feet above the tapping point, assuming no motion in the tube and gauge pressure measured relative to atmosphere.
This relationship is one reason head is so useful. Pressure can be given in pounds per square inch, but head turns that pressure into a height. For water at ordinary conditions, a pressure of about 1 psi corresponds to about 2.31 feet of water head. So a water pressure of 50 psi corresponds to roughly 115 feet of water head.
The pressure line answers a direct question:
How much pressure does the fluid have at each point in the pipe?
That matters for several reasons.
Low pressure can cause service problems, air release, or vapor pressure concerns. High pressure can overstress pipes, joints, valves, and fixtures. Pressure also affects pump selection, surge risk, leakage, and the ability to supply elevated users.
A pressure line is often drawn along the pipe profile as a height above the pipe centerline. If the pipe climbs a hill while the pressure head stays the same, the pressure line follows the pipe upward. If pressure drops because of friction, the pressure line drops relative to the pipe as flow moves downstream.
A key detail: pressure head alone does not include the elevation of the pipe. That is why the pressure line and the piezometric line differ.
The piezometric line combines pressure and elevation
The piezometric line shows the sum of elevation head and pressure head:
```text
Piezometric head = z + p/γ
```
This is also called the hydraulic grade line, or HGL, in many pipe-flow discussions. It represents the level to which water would rise in piezometers installed along the pipe, measured relative to a common datum.
If you connect vertical tubes to a pressurized pipe at several points, the height of water in each tube marks the piezometric head at that location. Connecting the tops of those water levels gives the piezometric line.
This line answers a slightly broader question:
How much pressure-energy plus elevation-energy does the fluid have at each point?
The difference between the piezometric line and the pipe centerline at any section is the pressure head. That makes the line very practical. If the piezometric line sits 40 feet above the pipe centerline at a point, the gauge pressure there is 40 feet of water head, or about 17 psi.
The piezometric line is especially powerful because it uses one fixed reference datum. That allows direct comparison between points at different elevations.
Imagine a pipe that rises from a low reservoir to a high tank. Near the low reservoir, the pipe may have a large pressure head because it sits low. As the pipe climbs, some energy converts into elevation. The piezometric line may slope downward along the flow because of friction losses, while the pipe itself rises and falls beneath it.
At any point:
If the pipe centerline lies below the piezometric line, gauge pressure is positive.
If the pipe centerline reaches the piezometric line, gauge pressure is zero.
If the pipe centerline rises above the piezometric line, gauge pressure is negative relative to atmosphere.
Negative gauge pressure does not always mean failure, but it deserves attention. If pressure drops too low, dissolved gases may come out of solution, air may enter through leaks or air valves, and the pressure may approach vapor pressure. In water systems, that can lead to cavitation or column separation under certain conditions.
The energy grade line sits above the piezometric line
A third line often appears with the pressure line and piezometric line: the energy grade line, or EGL. It represents total head:
```text
Energy head = z + p/γ + V²/(2g)
```
The piezometric line excludes velocity head. The energy grade line includes it.
The vertical distance between the energy grade line and the piezometric line equals:
```text
Velocity head = V²/(2g)
```
In a pipe with constant diameter, steady incompressible flow, and constant flow rate, velocity stays constant. The energy grade line and piezometric line then run parallel, separated by the same velocity head. Both slope downward in the direction of flow because friction consumes mechanical energy.
In a pipe with changing diameter, the spacing changes. If the pipe narrows, velocity increases, so the velocity head increases. The energy grade line remains above the piezometric line, but the gap becomes larger. The piezometric line may drop sharply through a contraction because part of the pressure head converts into velocity head and part is lost to turbulence.
The energy grade line is useful because it shows the full mechanical energy available in the moving fluid. The piezometric line is useful because it shows pressure behavior directly. Together, they explain whether pressure changes come from elevation, friction, velocity changes, or added energy.
A pump raises the energy grade line. A turbine lowers it. A valve causes a local energy drop. A reservoir surface creates a known head location because velocity at a large reservoir surface is usually small.
The pressure line, piezometric line, and energy grade line are connected, but each tells a different story:
Line | What it represents | Main use |
Pressure line | `p/γ` relative to the pipe centerline | Shows local pressure head |
Piezometric line | `z + p/γ` | Shows hydraulic grade and pressure relative to elevation |
Energy grade line | `z + p/γ + V²/(2g)` | Shows total mechanical energy head |
For many water-distribution and pipeline problems, the piezometric line becomes the most important visual tool because it shows pressure head in relation to the ground profile and pipe elevation.
Friction makes the piezometric line fall in the flow direction
In an ideal frictionless pipe, the energy grade line would stay level unless a pump, turbine, or diameter change affected it. Real pipes are not frictionless. Water rubbing against the pipe wall and turbulence inside the flow convert mechanical energy into heat. That energy no longer supports pressure, elevation, or velocity.
Because of this loss, the piezometric line usually slopes downward in the direction of flow.
For a pipe reach with constant diameter and no pumps or turbines, the extended Bernoulli equation between point 1 and point 2 can be written as:
```text
z₁ + p₁/γ + V₁²/(2g) = z₂ + p₂/γ + V₂²/(2g) + hL
```
Where `hL` is head loss.
If the pipe diameter is constant, `V₁ = V₂`, so the velocity terms cancel:
```text
z₁ + p₁/γ = z₂ + p₂/γ + hL
```
That means the drop in piezometric head equals the head loss:
```text
HGL₁ - HGL₂ = hL
```
This is why the piezometric line slopes downhill even in a horizontal pipe. In a horizontal pipe, `z` stays constant, so the drop appears as a pressure drop. In a rising pipe, pressure may drop more sharply because the flow loses energy to both elevation gain and friction. In a falling pipe, pressure may increase locally because elevation decreases, even while total energy still decreases.
This last point can surprise people. A downstream point can have a higher pressure than an upstream point if the pipe drops steeply enough. Energy still moves in the correct direction because the piezometric head, and the energy head, account for elevation. The pressure alone does not tell the full story.
Head loss in pressurized pipe flow usually comes from two sources.
Major losses come from pipe friction along the length of the pipe. They depend on pipe length, diameter, roughness, flow velocity, and fluid properties.
Minor losses come from fittings and changes in flow path, such as:
Bends
Valves
Tees
Entrances
Exits
Sudden expansions
Sudden contractions
Meters and strainers
The term “minor” can be misleading. In a short piping system with many fittings, these losses can be a large part of the total head loss.
On a profile drawing, major losses create a steady decline in the piezometric line. Minor losses often appear as local drops at fittings, valves, or transitions.
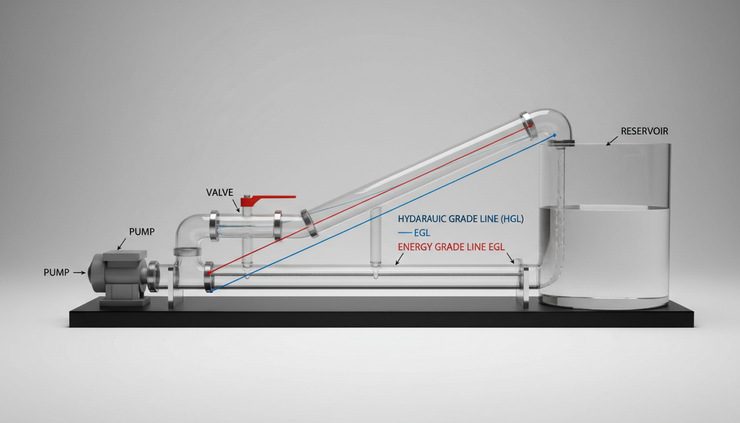
Pumps, tanks, and valves change the lines in different ways
Real piping systems often include equipment that adds, removes, or dissipates energy. The piezometric line makes those effects easy to see.
A pump lifts the energy and piezometric lines
A pump adds head to the fluid. Across a pump, the energy grade line jumps upward by the pump head, minus any internal losses already included in the pump performance. The piezometric line also usually jumps upward, though the exact change depends on pipe diameter and velocity head on each side.
If suction and discharge pipes have the same diameter, the velocity head is about the same on both sides. In that case, the pump’s added head appears mostly as a rise in piezometric head.
This helps explain why pump location matters. If a pump sits too high above the supply reservoir, pressure on the suction side may become very low. The pressure line can reveal whether the suction pressure approaches vapor pressure, which raises cavitation risk. Good pump layout keeps enough available head at the inlet.
A tank fixes the piezometric level at its water surface
An open tank or reservoir exposed to the atmosphere provides a known pressure condition. At the free surface, gauge pressure is zero. If the water surface is large compared with the pipe, the velocity at the surface is usually negligible.
That means the piezometric head at the tank surface is approximately equal to the water surface elevation:
```text
HGL ≈ zwater surface
```
For a pipe connecting two reservoirs, flow moves from higher head to lower head, not simply from higher elevation to lower elevation. If two tanks have different water surface elevations, the difference in their water levels provides the head available to overcome pipe losses.
If the downstream reservoir sits lower, gravity may drive the flow. If the downstream tank sits higher, a pump may be needed. The piezometric line shows this immediately.
A valve creates a local drop
A partially closed valve dissipates energy. On an HGL or EGL sketch, a valve appears as a sudden downward step in the direction of flow. The stronger the throttling, the larger the drop.
This behavior has a practical consequence. Throttling a valve reduces flow by adding head loss. It does not create energy. It wastes mechanical energy as turbulence and heat. Sometimes that is acceptable, as in flow control. In other cases, a better pump selection or pipe sizing choice can reduce unnecessary loss.
A pipe contraction changes pressure and velocity
When a pipe narrows, velocity increases. Since the energy grade line includes velocity head, the gap between EGL and HGL grows. Pressure head often drops through the contraction because some piezometric head converts into velocity head and some energy is lost.
When a pipe expands, velocity decreases. Some velocity head may convert back to pressure head, but not all of it. Sudden expansions can lose significant energy to turbulence. Gradual transitions reduce that loss.
This is why pipe size affects more than capacity. It changes velocity head, friction losses, pressure distribution, and the shape of the piezometric line.
A simple example shows how the lines work together
Consider a straight, horizontal pipe that carries water from left to right. The pipe diameter is constant, and the flow is steady. Because the pipe is horizontal, elevation head `z` stays the same. Because the diameter is constant, velocity head also stays the same.
The only major change along the pipe is pressure loss due to friction.
At the upstream point:
```text
z₁ + p₁/γ + V²/(2g)
```
At the downstream point:
```text
z₂ + p₂/γ + V²/(2g)
```
Since `z₁ = z₂` and velocity head is the same at both points, any energy loss must come from pressure head. The pressure line and piezometric line both slope downward by the same amount.
Now change the example. Let the same pipe climb uphill while keeping the same diameter and flow rate. Velocity head still stays constant, but elevation head rises. The piezometric line still slopes downward because of friction, but the pipe centerline rises toward it. The pressure head shrinks faster than it would in a horizontal pipe.
At the high point, the pipe may sit close to the piezometric line. That means pressure is low. If the pipe rises above the piezometric line, the gauge pressure becomes negative. The system may still carry flow, but it becomes more vulnerable to air entry, vapor pockets, and operational problems.
Now let the pipe drop downhill. The piezometric line still slopes down in the direction of flow, but the pipe centerline may fall faster than the HGL. In that case, pressure head increases downstream, even though total available energy decreases. This is common in gravity pipelines that descend steep terrain.
This example gives a useful rule:
Flow follows decreasing total energy, not necessarily decreasing pressure.
Pressure can rise in the direction of flow if the pipe drops in elevation. Pressure can fall in the direction of flow if the pipe rises or friction is high. The piezometric line keeps the accounting clear.
Common mistakes when reading pressure and piezometric lines
Misreading these lines can lead to wrong conclusions about a pressurized system. Several mistakes show up often.
Treating pressure as total energy
Pressure is only one part of the energy picture. A high-pressure point at low elevation may have the same piezometric head as a lower-pressure point at high elevation. Velocity head also matters when pipe diameters change.
A pressure gauge tells the pressure where it is installed. It does not directly tell the full energy head unless elevation and velocity are also considered.
Forgetting the datum
Piezometric head includes elevation, so every value must refer to the same datum. The choice of datum can be arbitrary, such as sea level, site benchmark, or a local project elevation. The choice does not change the physics, but mixing datums breaks the analysis.
Pressure head measured from the pipe centerline and hydraulic grade measured from a project datum are related, but not the same drawing element.
Ignoring velocity head in small or fast pipes
In large, slow water mains, velocity head may be small compared with pressure head and elevation changes. In small pipes, nozzles, force mains, and high-velocity systems, velocity head can matter a lot.
If the energy grade line and piezometric line are assumed to be the same, the analysis may miss important pressure drops at contractions, meters, and valves.
Drawing the HGL upward through ordinary pipe flow
Without a pump or another energy source, the energy grade line cannot rise in the direction of flow. The piezometric line can rise locally in a pipe expansion or steep downward pipe if velocity or elevation changes allow it, but the energy grade line must still account for losses.
For constant-diameter pipe without added energy, the HGL typically falls along the flow path.
Confusing gauge pressure and absolute pressure
Most water-system pressure gauges read gauge pressure, measured relative to atmospheric pressure. Cavitation and vapor pressure concerns require absolute pressure. A point with negative gauge pressure may still have positive absolute pressure, but the margin may be small.
This distinction matters most near pump suctions, high points in pipelines, siphons, and fast local contractions.

How engineers use these lines in practical system checks
Pressure and piezometric lines turn equations into a picture. That picture helps with design, troubleshooting, and operation.
In water distribution, the hydraulic grade line shows whether customers at high elevations receive enough pressure. It also helps identify zones that may need pressure reducing valves, booster pumps, or storage tanks.
In long transmission mains, the HGL reveals high points where air valves may be needed. It also helps locate places where negative pressure could occur during normal operation. Under transient conditions, such as pump shutdown or rapid valve closure, pressure can change quickly. Steady state analysis does not replace surge analysis, but it provides the baseline.
In pump systems, the pressure line and HGL help check suction and discharge conditions. The suction side must maintain enough pressure to avoid cavitation. The discharge side must provide enough hydraulic grade to overcome elevation, friction, and required delivery pressure.
In industrial piping, these lines help estimate the pressure available at equipment inlets. Filters, heat exchangers, control valves, and meters all add losses. Sketching the HGL across those components can show whether a pump has enough head and whether pressure ratings are suitable.
In gravity pipelines, the piezometric line helps detect whether the pipe will remain pressurized. If the pipe profile rises above the HGL, flow may not behave as a simple full-pipe system. Air pockets and part-full flow can appear, depending on system details.
A practical review often asks these questions:
Where is the highest point in the pipe?
How close does the piezometric line come to the pipe centerline?
Where is pressure highest?
Where does the largest head loss occur?
Does any valve create an excessive local drop?
Does the pump add enough head for the required flow?
Are pressure ratings adequate under normal and abnormal conditions?
These questions connect the drawing to real decisions.
The main takeaway
Pressurized steady state flow becomes much easier to understand when pressure, elevation, velocity, and losses are shown as head lines.
The pressure line shows pressure head relative to the pipe. The piezometric line shows pressure head plus elevation head, which makes it the main guide for hydraulic grade. The energy grade line adds velocity head and shows total mechanical energy.
In a real pipe, friction lowers the energy grade line in the direction of flow. Pumps lift it. Valves and fittings drop it. Changes in elevation and diameter shape how much of the remaining energy appears as pressure.
A good hydraulic profile does more than support calculations. It shows where the system is comfortable, where it is strained, and where a small design change could prevent a large operating problem.


Comments